What is a Gantt chart?
Table of Contents
Whether you are just starting out in business or have been managing your operations for years, you may have heard the term ‘Gantt chart’ and wondered what it meant. Gantts can look intimidating at first, but they are not as complex as you may think and could make running your business and projects much simpler and more efficient. This article will define what a Gantt chart is by looking at the following areas:
- What is a Gantt chart?
- What are the uses of a Gantt chart?
- How to draw up a Gantt chart
What is a Gantt chart?
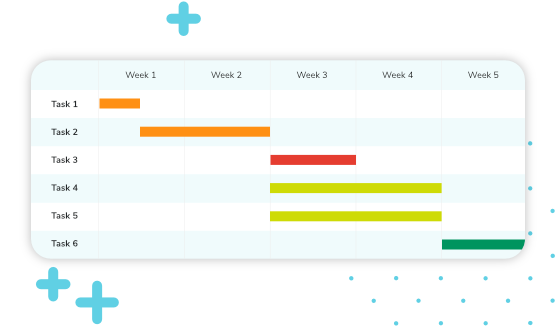
A Gantt chart is a visual representation of a timeline that shows a list of activities and the timescale a project will be completed in. This makes it easy to quickly understand the scale and length of time a project needs.
On the left side of the chart there is a list of activities, which is a breakdown of every task that will be completed in the project. Along the top of the chart will be a timeline, which could be broken down either by day, week or month – whichever is more suitable for the project. Each task will have a bar that shows the date the activity will start and its length indicates how long that activity will take to complete.
This is what a basic Gantt will include, but you can also add columns to include who is responsible for tasks or how many hours tasks are expected to take. Gantt charts are highly customisable, so that they can reflect exactly what you need for each project.
Gantt charts can allow you to see the following things at a glance:
- Start date of the project
- Individual tasks
- Who is working on each activity
- When tasks begin and end
- How long each task will take
- Finish date of the project
- Groups of tasks for different stages of a project
- Overlapping tasks or which tasks rely on completion before another can begin
Why are Gantt charts useful?
Gantt charts are mainly used to manage projects, but that’s not to say that you can’t use them for other purposes, such as plotting your annual business goals or growth plan.
Here are some of the ways that Gantt charts can be useful for business or project management:
- The breakdown of tasks can ensure nothing slips through the cracks and keeps you on track for completion.
- The timeline can keep you accountable to your client. It can help focus your work on each task as you have a visual reminder of what each one is contributing to and when it needs to be finished by.
- Including dates will help you organise time and tasks more effectively than monthly or weekly batches of tasks.
- The horizontal bars act as markers on the right side, representing tasks’ progress, duration, start and end dates, to give you a better idea of how to manage your workload.
- Adding in highlighted bars or milestone markers that need to be reached can act as an indication of progress, a motivator and also a deadline that you can calendarise.
- It can be useful to add a resource, or a ‘Who’, column to indicate the individual or team who will be completing a task.
- If you are charging a client by the hour, it’s important to add a column for predicted hours and the actual hours you worked on the task. This will allow you to create realistic estimates for price and budgets.
Gantt charts are a simple way to communicate project details with any involved parties, whether they are clients, colleagues, investors or management. It keeps everyone on the same page about the progress of the project.
How to draw up a Gantt chart
You can use Gantt chart software, which you may pay a fee for, or you can just as easily create a simple Gantt chart using a spreadsheet such as Excel or Google Sheet.
To get started you have to consider a few things: when does the project need to finish and what are the important milestones you need to hit to ensure completion happens on time? This will give you your timeline axis and you can mark the milestone dates with a coloured cell or symbol.
Then, break down the stages of the project. Note down every task that will go into the stage and list these down the vertical column, in the order they need to be done. Be as detailed as you can with the tasks as this will give a more realistic view of what needs to be done to complete the project.
Next to every task, highlight or colour fill the cell in your spreadsheet that corresponds to the column of the start date. If your timeline is weekly, highlight multiple cells that are next to each other to indicate that this task will last a few weeks. For example, you might have three coloured cells in a row to indicate a three-week task.
Work your way down the task list and fill in the cells for each task’s duration. You may find that some of the completion dates overlap, which might allow you to build in some leeway for yourself in case a task takes longer or shorter than you expected.
Once you have the task times on your sheet, then add columns that are helpful for you, such as ‘individual responsible’ or ‘expected hours’ and ‘hourly rate’ if those apply. Customise this to suit you and your client’s needs. Adapt and update your Gantt chart as the project goes on, this doesn’t necessarily have to be a document that is set in stone.
Save time to focus on running your business
Countingup is a business current account and accounting software in one app, providing instant invoicing and automated bookkeeping. It is saving business owners hours of time-consuming work and helping thousands keep on top of their finances.
Find out more here to save yourself hours of accounting and financial admin and focus on hitting your project milestones.